

Imagine you do a high throughput screening campaign, how do you know your assay is reliable enough to generate meaningful hits? Well, one might use signal-to-background (S/B) or signal-to-noise (S/N). However, both parameters fail to fully capture the variability in the sample and the background. Zhang et al. introduced the Z-factor in 1999 to address these sorts of challenges for HT assays https://doi.org/10.1177/108705719900400206
Since the introduction, the Z-factor has become the main statistical measure to assess the quality of an assay. It quantifies the separation or “signal-to-noise” ratio between the positive and negative controls or sample and controls in a screening assay. Z-factor indicates the ability of an assay to discriminate between compounds that show an effect (positive) and those that do not (negative) based on the separation of their distributions.
The Z-factor is calculated as follows:
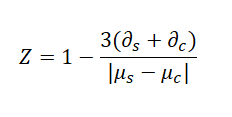
Where:
∂s,∂c are the standard deviations of the samples and the control, respectively.
μs,μc are the means of the samples and controls, respectively.
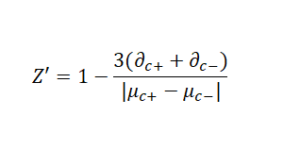
∂c and μc are replaced with the mean and standard deviation of positive controls and negative controls for agnostic/activation and antagonist/inhibition assays respectively. A more practical/used/known variation of the Z-factor is the Z’-factor, also known as Z-prime.
While they are practically different, the two terms are used interchangeably often (including in Wikipedia). Z’ is a characteristic parameter for the overall quality of the assay whereas Z is more related to the separation between the signal of the sample and the control. In practice, the assay conditions, such as control selection, reagents, and instruments, are first optimized using Z’. Then, test-compound-related parameters, such as compounds’ concentrations, are tuned by screening a subset of the library to meet Z criteria. The Z-prime (and Z-factor) can take on various ranges and values, each indicating different levels of assay quality:
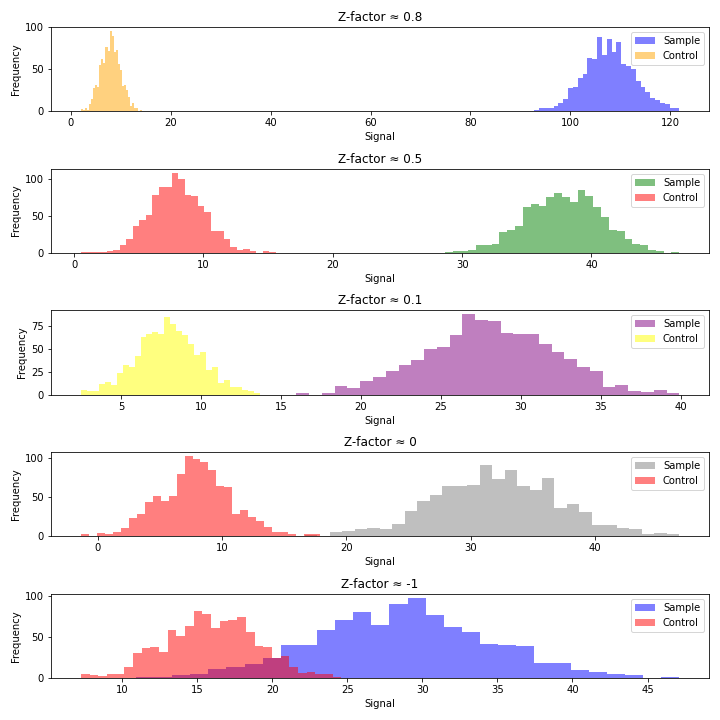
Z-factor close to 1:
An excellent assay with a well-separated distribution of positive and negative controls. Indicates a robust and reliable assay that can effectively distinguish between compounds that elicit an effect (positive) and those that do not (negative). Typically considered highly suitable for high-throughput screening due to the clear separation between controls.
Z-factor between 0.5 and 1:
Represents a good assay with acceptable separation between positive and negative controls. Indicates that the assay is reliable for high-throughput screening but might have less distinct separation than an excellent assay. Still considered suitable for screening, though with some caution and potential for improvement. This Z range requires strong controls which is usually achievable in small-molecule screening.
Z-factor between 0 and 0.5 (0 < Z < 0.5):
Suggests a less reliable assay with minimal separation between positive and negative controls. Indicates a lower quality assay, less effective in distinguishing between compounds that induce an effect and those that do not. Can be used for screening, but caution is needed, and optimization or modifications may be beneficial.
Z-factor below 0 (Z < 0):
Indicates poor assay performance with overlapping or indistinct positive and negative controls. Suggests that the assay is unsuitable for high-throughput screening due to the lack of separation between controls. Signals the need for significant assay optimization, modification, or potential re-evaluation.
While Z’ is the most widely used QC criterion in HTS, it does have some limitations. The Z-factor assumes that the data distributions for both positive and negative controls (and samples) are approximately normal (Gaussian). If the data deviates significantly from a normal distribution, the Z-factor may not accurately reflect assay performance. This can be especially problematic for small sample sizes (n<30). It is worth noticing that the Z-factor primarily addresses random errors and may not detect systematic errors or biases. In other words, an assay with acceptable Z-factor values may still exhibit systematic errors, impacting the reliability of the results. Moreover, the Z-factor primarily focuses on false positives but provides limited information on false negatives. Some of these can be alleviated by utilizing more robust statistical parameters, such as median instead of average and median absolute deviation (MAD).
Despite these limitations, the Z-factor remains a valuable and widely used metric in high-throughput screening, but it is important to use it judiciously and in conjunction with other quality metrics, such as the dynamic range, assay robustness, and false-positive rates, for a comprehensive assessment of assay performance. It is worth reiterating that the Z-factor may oversimplify the assessment, and a borderline Z-factor may still indicate an assay with useful characteristics especially when screening biologicals. A high Z-factor also does not guarantee the ability to detect biologically relevant compounds (true hits).
This post was just an introduction to the application of Z-factor. There will be more in-depth HTS data analysis posts here so subscribe to our newsletter now! If there is a topic that you would like to see here or have a question, please drop us a line at hello@assay.dev
You can find the Jupyter Notebook that was used to generate the figure in our GitHub repo https://github.com/Assaydev/Z-factor/blob/main/Z-factor.ipynb you can play it with changing average and standard deviations.
Happy Screening!