Human embryonic stem cells (hESC) and induced pluripotent stem cells (iPSC) can differentiate into various cell lineages including bone, cartilage, fat, muscle, and neurons. In recent years, there has been growing interest in using hESC and iPSC for developing cell therapies and tissue engineering because of their differentiation capacity. For instance, Fate Therapeutics focuses on cancer and immunological illnesses by developing programmed cellular immunotherapies using iPSC-derived NK and T-cells. Whereas, Sana Biotechnology aims to develop engineered cells as therapeutics using pluripotent stem cells to replace any missing or damaged cells in the body.
To achieve high reproducibility production, it is critical to monitor and track the migration, proliferation, and differentiation of these cells in vitro (and in vivo). Accordingly, various assays exist to check bio-markers in transcription and translation levels. In this post, we introduce a few most popular methods that are widely used to study genomic expression profiles. These include microarray analysis, RT-qPCR, and RNA sequencing. Each of these techniques offers advantages and has limitations that are briefly summarized in Table 1.

Table 1. Summary of popular techniques that are used to study gene expression profile of iPSC and hESC.
1. Microarray Analysis
Microarray technology, which emerged in the early 1990s, revolutionized genomics by enabling simultaneous analysis of thousands of genes. Microarray was originally developed in two main forms. The cDNA microarrays by Patrick Brown’s team at Stanford and oligonucleotide microarrays by Stephen Fodor at Affymetrix. The latter used synthesized short DNA sequences fixed on a chip, allowing for more precise control over probe placement and a higher degree of miniaturization which made it quickly moved from academic labs to widespread commercialization. Although faced with competition from next-generation sequencing in the 2010s, microarrays have retained a significant role in clinical diagnostics and large-scale studies due to their cost-efficiency and established workflows. Currently, there are several instruments in the market each with unique features and limitations such as Affymetrix, now part of Thermo Fisher Scientific, Nanostring nCounter, and Illumina’s BeadArrays. Regardless of the technology, a microarray workflow typically starts with RNA extraction. Although there are protocols that directly use cell lysis, RNA isolation is advised for better-quality microarray data. Additionally, RNA extraction allows for more robust cDNA synthesis (if needed). Upon isolating RNA (and cDNA synthesis if needed) hybridization is performed where labeled nucleic acid samples (RNA or DNA) are allowed to bind, or hybridize, to complementary DNA probes attached to the microarray chip. There are pre-made panels that contain variant markers relevant to the status of the cell, it is also possible to produce custom panels based on literature. The microarray is then scanned with a laser, which excites the fluorescent dye, allowing the measurement of fluorescence intensity emitted from each spot on the array. The intensity of the fluorescence at each spot on the array is proportional to the amount of target nucleic acid binding to the probe, which reflects the gene expression level of that gene in the sample.
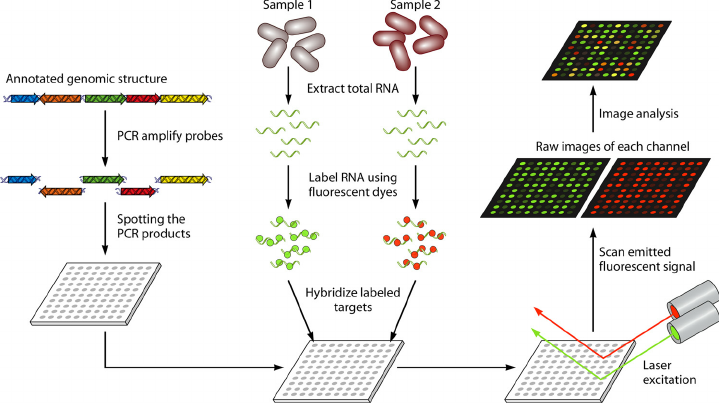
Figure 1. Typical microarray workflow from mRNA to data from here DOI: 10.1128/CMR.00019-09
2. Reverse Transcription Quantitative Polymerase Chain Reaction (RT-qPCR)
The development of RT-qPCR occurred in the 1990s, with the first systems introduced by Applied Biosystems in 1996. This technology integrates fluorescent chemistry to provide quantitative results, enabling the real-time accumulation of amplified DNA during the PCR process. RT-qPCR revolutionized genetic analysis by allowing for precise quantification of nucleic acids, making it invaluable in clinical diagnostics, research, and even forensic applications. Its ability to detect and quantify gene expression and genetic mutations rapidly and sensitively underpins its broad adoption across stem cell research.
RT-qPCR workflow involves (optional) RNA extraction followed by reverse transcribing RNA into complementary DNA (cDNA) and then amplifying specific cDNA sequences using PCR. RT-PqCR is widely used to analyze gene expression in embryonic stem cells and induced pluripotent stem cells. For instance for identification of stem cell markers such as Oct4, Nanog, and Sox2 (pluripotency markers. RT-qPCR is also widely employed to evaluate the purity and quality of stem cell populations by quantifying the expression levels of genes associated with undesired cell types or differentiation stages. For instance, the expression of lineage-specific markers (e.g., hematopoietic markers for mesenchymal stem cells) can be assessed to ensure the absence of contaminating cell populations. The main disadvantage of RT-qPCR is its lower throughput (usually limited to <90 markers) and the fact that it can be affected by inconsistencies in PCR.
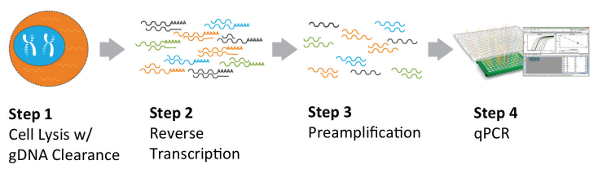
Figure 2. Typical RT-qPCR from here https://www.americanlaboratory.com/
3. RNA-Sequencing (RNA-Seq)
Initially described in 2008, RNA-seq allows researchers to detect both known and novel transcripts, quantify gene expression levels, and identify isoforms, providing a comprehensive view of the transcriptomic landscape. It involves sequencing cDNA libraries generated from stem cell RNA, allowing for the detection of novel transcripts, alternative splicing events, and gene expression levels. The main advantage of RNA-seq is that can detect both known and novel transcripts, providing a more comprehensive (and individual) view of the stem cell transcriptome compared to microarrays or RT-qPCR. Despite the unparalleled potential, RNA-seq workflow can be lengthy, costly, and it requires complex data analysis pipelines which limit its routine usage. Nonetheless, applications of RNA sequencing and its derivatives such as single-cell RNA-seq is rapidly growing in the field. Refer here for more info doi: 10.1101/gr.223925.117
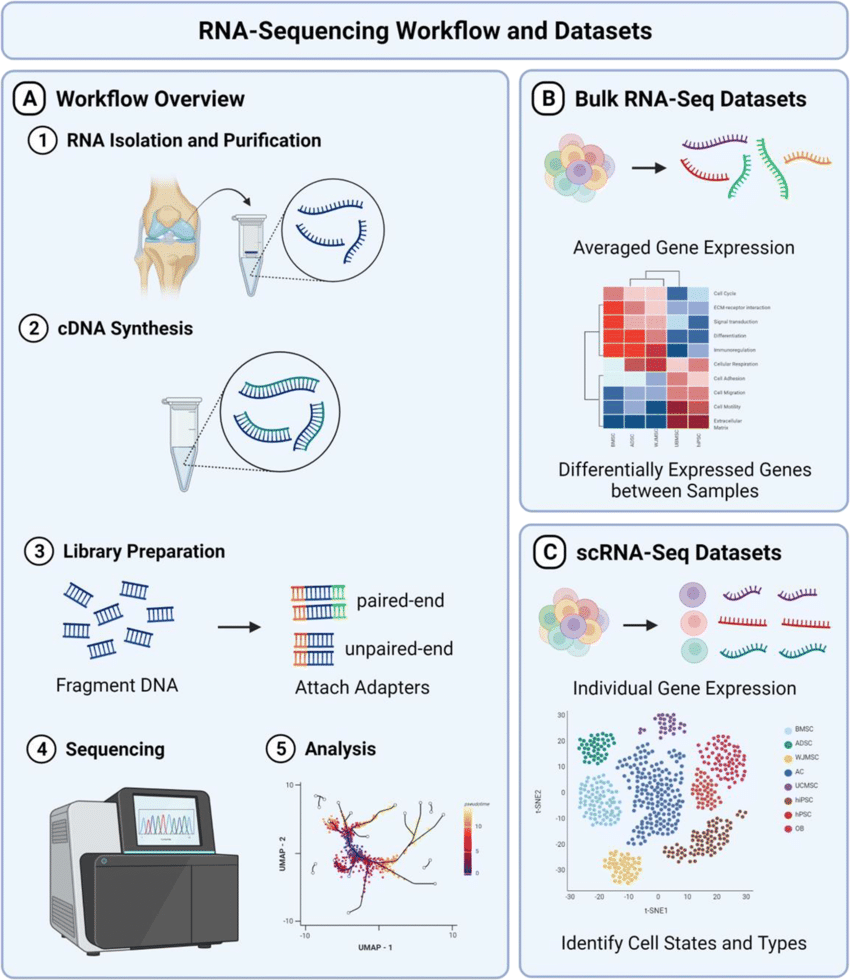
Figure 3. Typical RNA-seq workflow from from here DOI: 10.1007/s11914-022-00726-x
There are other methods to measure gene expressions such as northern Blotting and Massively Parallel Signature Sequencing (MPSS) that are less common due to their limitations and the existence of better alternatives. In future posts, I will review assays that are available to study hESC and iPSC in the protein level.
If there is a topic that you would like to see here or have a question, please drop us a line at hello@assay.dev